
Coming off a rather intriguing year where the private residential market seemed to pick up momentum at the end of 2017, this year is poised to be one that embraces the whole impact of the recovery phase. The aforesaid momentum gained last year can be said to be rather unprecedented, with rapid en bloc sales as well as increase in demand across all private residential property types.
In this article, we will identify the underlying factors that are likely to contribute to the improving performance of Singapore’s residential market, which includes: analysis of the Residential Private Property Index (PPI), the softening of cooling measures as well as the progressively rising developer sales.
As we all know, nothing stays the same forever – and that has always been the way for investments where everything works in a cycle. This cycle is also precisely what can be seen from Singapore’s Residential PPI as indicated below:
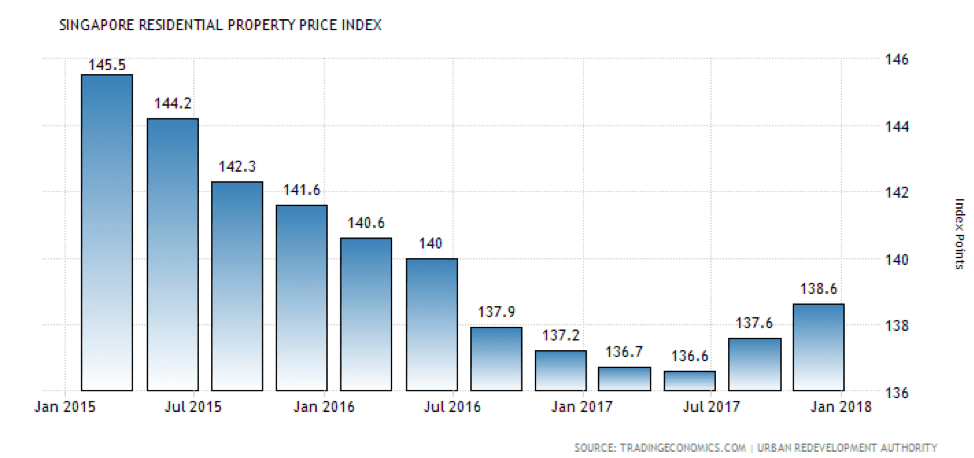
There is a clear U-shaped cyclical trend for the recovery phase as indicated above, with significant evidence that the recovery phase beginning at the end of 2017. Nevertheless, for the whole of 2017, the PPI increased by 1 percent, a slight improvement after having decreased by 3.1 percent in 2016. It is, however, important to note that this was the first annual rise in private home prices since 2013. Simultaneously, 2013 was also the year where Singapore’s Residential PPI reached an all time high of 154.60 Index Points. Taking that into consideration, could 2018 be the year which will be the catalyst for a performance which might surpass 2013?
For now, it is hard to say but the signs are promising for sure.
1st sign: Relaxation of cooling measures
A factor that can be said to play a huge role in the progressive recovery of the market can be attributed to the relaxation of cooling measures by the government. To recap: in March 2017, the government has decided to make some amendments amongst the existing property cooling measures in place, of which the prominent ones (TDSR and SSD) are as follows:
TDSR
According to the Government, they have received feedback from some borrowers that the TDSR framework has mitigated their flexibility to monetise their properties in their retirement age (for instance, to borrow against the value of their properties to obtain additional cash). As such, changes were made to relax the measure – the TDSR framework is no longer applied to mortgage equity withdrawal loans with LTV ratios of 50% and below.
SSD
Currently, the SSD is payable by those who sell their residential property within 4 years of purchase, with rates ranging from 4% to 16% of the property’s value. However, the number of sales transacted within the 4 years window has dropped significantly since the introduction of this measure. As such, the government has decided to revise the SSD as follows:
- Impose SSD on holding periods of up to 3 years, a revised figure from the current 4 years
- Lower the SSD rate by four percentage points for each tier. The new SSD rates will range from 4% (for properties sold in the third year) to 12% (for those sold within the first year)
Of course, the true impact has yet to be seen, although theoretically, residential properties are touted to be more affordable. Nevertheless, towards the end of 2017, there were some evidence of a pickup in residential sales, especially so for developer sales.
2nd Sign: Remarkable improvement for Developer Sales
It is imperative to note that 2017 ended with an impressive performance for the developer sales market for private homes. Developer sales were 17% higher on a year-on-year (YoY) basis, having 367 units more transacted in December 2017 as compared to December 2016. Notwithstanding that, overall, the total number of developer sales transactions in 2017 was 10, 682 units, 34% above that of 2016’s as well as representing the best performance of the market since 2013.
In terms of prices, URA’s residential price index have indicated a 0.7% quarter-on-quarter (QoQ) increase in Q4 2017, which hence brought about an overall residential price growth for the year to 1%, significantly representing the first positive annual growth since 2013 as well. Could this a positive sign of another unprecedented performance to come? It indeed remains highly possible, should the developer sales continue to improve progressively.
3rd Sign: The faster the recovery, the shorter the cycle
Besides the increased affordability, as well as bullish sentiments and evident increased in demand for private residential properties, another promising sign that the market performance in 2018 is probably able to exceed expectations is due to the theory of the property price cycle.
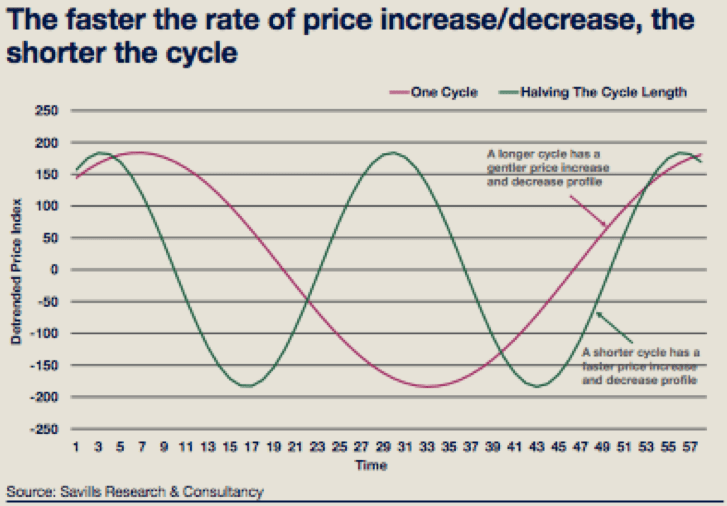
The above graph as generated and obtained from Savills have actually portrayed this theoretical assumption clearly – that the faster the rate of price increase or decrease, the shorter the cycle will be. The oscillations here, backed by the accelerating recovery phase of the residential property market, are all pointing to the possibility of a rather quick upward movement for demand and prices of Singapore’s prices. Perhaps it is a bit presumptuous to say that 2018 will be the year the market will peak; however, it is indeed highly likely that this year will be a year of growth for Singapore’s residential market.
All-in-all, the bottom-line is that 2018 will be highly likely to be a year of growth for the Singapore private residential market. The recovery phase is expected to continue, and bearing any negative unforeseen circumstances, the rate of recovery will probably accelerate through to 2019. On that note, should you be an investor or home buyer that aims to capitalise on this trend, it is best to seek the advice of an established mortgage advisory firm such as Redbrick to assist you with the most optimal financings.