
Introduction: End of An Era of Cheap
This is already old news – the US Fed raised rates again, as anticipated, on 14th June 2017, bringing the target rate to 1.25%. They are expected to raise again to 1.4% in the second half of the year, and then to 2.1% in 2018.
We also saw a “hike” ourselves, towards and over the weekend whenever there are such announcements, in the form of concerned queries by new and existing home owners and property investors. Even though the announcement has already been “priced-in” by the markets, we scramble to find a crystal ball among ourselves to foretell how fast or how soon interest rates may move for us locally.
Well, I believe no one’s the wiser but we can mostly agree that the trajectory is on the uptrend rather than down. With that, and using some of the other observations I have noticed over the past 18 months or so, I would like to propose that the era of cheap rates is finally coming to an end. As residential property prices and transactional volumes are looking to rebound from the bottom, so will the cost of financing our new purchases, or refinancing our existing assets.
Observation (1): Look at the Blips/Upticks
US Fed Rate Historical Chart over the past 10 years
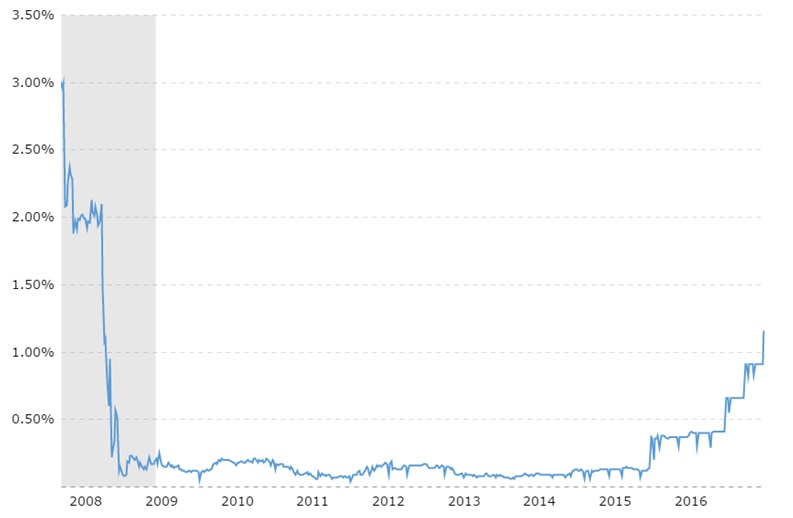 Credit: http://www.macrotrends.net/
USD/SGD exchange rate over the past 10 years
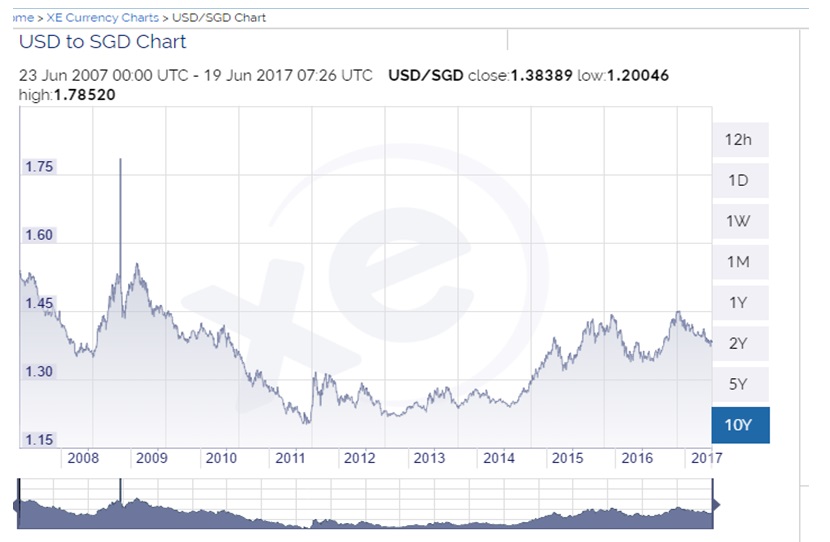 Source: XE
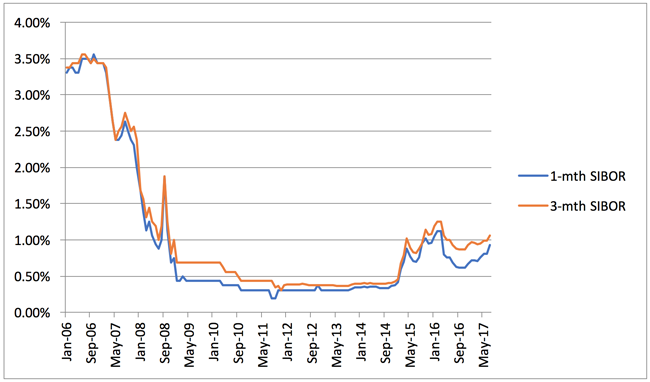
1M/3MSIBOR Rate Chart over the past 10 years
Comparison Table of The FD Rates Used by Banks to Price Current Mortgage Packages
| Bank | DBS | SCB | OCBC | UOB | MAYBANK |
| Reference Rate | Fixed deposit | Fixed deposit | Fixed deposit | Fixed deposit | Fixed deposit |
| Tenor | 9 months | 48 months | 36 months | 15Months | 36 months |
| Deposit | 1 – 10K | < 25k | < 20K | < 50K | 1 – 300K |
| Highest | 1.5% in 2008 | 1.00% in 2010 | 0.925% in 2005 | 0.50% in 2009 | 1.25% in 2003 |
| Lowest | 0.05% in 2012 | 0.5% in 2011 | 0.65% in 2011 | 0.25% in 2011 | 1.15% in 2011 |
| Unchanged since | 2015, maintaining at 0.25% (prior to this, the rate is at 0.5% since 2011) |
2011, maintaining at 0.50% | 2011, maintaining at 0.65% | 2011, maintaining at 0.25% | 2012 |
| Current rate | 0.25% | 0.65% | 0.65% | 0.25% | 1.20% |
On a serious note, how many charts would be enough to convince you to take notice of the trends? How many numbers do we have to go through together to notice that most figures are at their highest around 2008-2009 over the past 10 years and lowest at or from 2011 onwards? Notice the same “blips or upticks” in the above charts from 2015 to date?
If markets move in cycles and we have enjoyed low rates for so many years already, is your home loan rate going to be the only rate that stays low while others shoot up?
Observation (2): Batching; Reference Rates Are Changing
Again, if history is of any relevance, SIBOR used to be the most popular reference rate used for home loan packages, particularly between 2009 to end 2014. Fast forward to today: most people are avoiding SIBOR like the plague when it comes to using it for their mortgage pricing, even though it is still currently much closer to historically low levels.
The banks need a new “pet” rate for their home loan business. Hence, the FD-Linked Rates (Fixed Deposit Linked) were pioneered by DBS back in 2015 and several other banks have since widely adopted this pricing approach for their floating rate packages as well.
These rates – often referenced as the singular Fixed Deposit Rate, of a certain placement tenor, and used by the individual banks and their depositors – have been touted to be relatively more stable as compared to SIBOR.
I’m inclined to feel the same way too, well to a certain extent, especially if the rate changes are initiated at the sole discretion of the bank, and if they were to use only 1 FD reference rate in each bank.
However, this is no longer the case. In 2016, the FD reference rate of 1 bank changed. This year, again, another 2-3 banks have also changed or are changing their rates. This then begs the question: why the change?
To manage pricing, they can always adjust the margins they charge in addition to FD rates whenever they change or launch new and different home loan packages monthly. But to remove the previous FD reference rate, and use a completely new and different one, brings back unpleasant memories of the non-transparent legacy board rates that banks used to adopt, where they again have the absolute discretion to adjust the rates as and when they want, or change them altogether.
If a bank uses only a single FD reference rate today, they are generally less inclined to adjust the rate unnecessarily for fear of reputational risks and a significant exodus of clients. However, if they were to have different sets of FD reference rates for different “batches” of clients, these risks can be better managed and are effectively lower. Unfortunately, clients under these batching will reluctantly have to play a game of Russian Roulette, and see whose FD rates shoot up first, while they are being held hostage by the lock in periods of their loan packages.
Observation (3): Hedges are getting fewer and shorter
Just a very quick one on this portion. There are fewer Fixed Rate packages available this year than compared to last year. More notably, the hedging period is getting shorter. Last year, we could still apply for 5 years Fixed Rate packages, although the interest rate is not cheap (around 2% p.a.). On the other hand, the longest fixed rate period we can secure for this year is up to 3 years only.
When you apply for a fixed rate package with the bank, the bank effectively hedges your risk of rate increases and bears your costs if the interest rates are above your borrowing rate for a fixed period. If there are currently no more fixed rates for longer than 3 years, we can deduce that there is a general reluctance from the banks to hedge interest rate risks for more than 3 years. They may also be of the view that rates are likely to increase sooner and faster than not.
Is it too late to look at Fixed Rates Now?
Honestly, I wouldn’t think so. We can still secure a decent lock in of fixed rates @ 1.58% p.a. for either 2 or 3 years today. Even though it is slightly higher compared to last year’s best fixed rates at 1.4% p.a. fixed for 2 years, you will be glad to know that the rates are much cheaper for a term of 3 years. Last year’s offer was at 1.99% p.a.
When we look at the “safety premium” between fixed rates and floating rates, we will be glad to know that we are still paying around 0.2% more to keep our home loan rates fixed than to take a risk with floating rates over a 24 months period. The difference is even lower over 36 months. This is quite an anomaly because we usually pay more to get more safety. Thanks to the intense current competition between banks though, there is some sort of arbitrage for us to benefit from while their own margins are still being squeezed, for now.
Conclusion: Last Chance. Don’t Say I Did Not Warn You
I have provided you with some charts, and I have compared some figures and explained my rationale to you. You can argue that my data is not accurate. You can also argue that my arguments are not sound and one sided – and that’s because you are right – but you are also wincing at having to pay 0.2% or 0.3% for safety.
Don’t beat yourself up when rates do shoot up. There’s a lot of room between 0.8% and 3.5% (SIBOR). The potential increment for some of the FD reference rates are in multiples of 2,3, or more (Yes, I mean 100, 200% increase from the numbers that they are at today).The 3.5% used to stress test our loan eligibility via TDSR is there for a reason, and it’s not one of those measures or guidelines relaxed recently in March 2017.
A peace of mind is priceless, so get those Fixed Rates while you need not have to pay through your nose yet. Do not take unnecessary chances at the wrong time. Lastly, do not be held hostage by anyone or anything other than your own sensibility. Don’t say I didn’t warn you!