FORECASTING AND PREDICTING
We all know that the development and construction of a building takes years, and this results in a lagged relationship between demand and supply for properties. As early as 1876, an American political economist and journalist named Henry George observed this dynamic — which caused a cycle with recurring phases of booms and busts.
Understanding and analyzing of the real estate/ property cycle is therefore essential and will be beneficial, in order to enhance investment-decision capabilities and determine when is the ideal timing to buy properties, be it for investment or occupational purposes and for investors or homebuyers. Marketers too, have to be familiar with this consistent pattern, decide when to launch and implement new marketing strategies or activities.
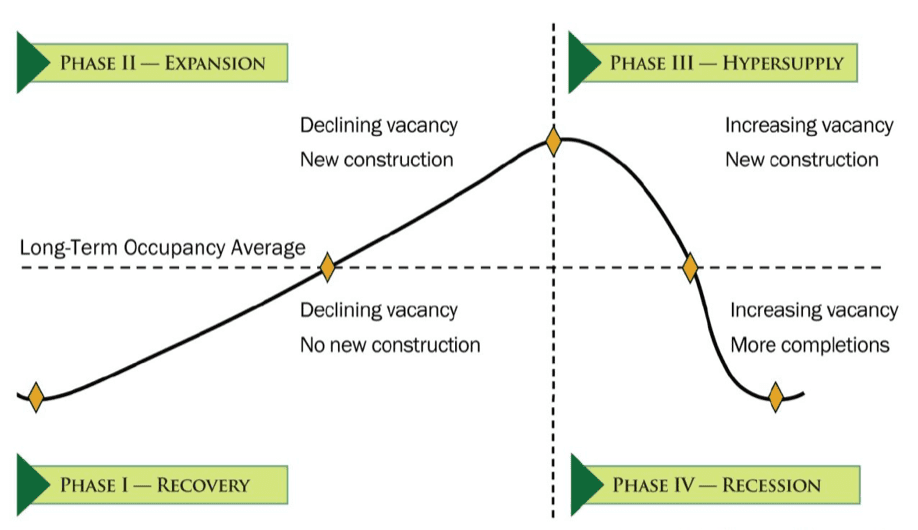
The real estate market cycle is measured by changes in prices and volume of sales of properties. It reveals four distinct phases, namely Expansion (peak), Decline, Recession (bottom or trough) and Recovery:
PHASE I: RECOVERY
Characterised by: Declining vacancy/ limited new construction/ stable but high rent growth
During this phase, the initial expansion is associated with the upswing of business cycle as improved economic conditions can encourage more developments and construction to take place, leading to more labor being hired. With increased employment, investors or homebuyers’ unsatisfied demand becomes effective demand when more people have the means to pay for property purchase. Furthermore, the lower interest rates and investment costs will encourage expansion of businesses as well as boost the volume of economy activities. This further contributes to the demand for land or buildings. As demand rises, prices will show an upward trend.
PHASE II: EXPANSION/ BOOM/ PEAK
Characterised by: Declining vacancy/ commencement of new construction/ rapid rent growth as demand exceeds supply/ fall in capitalization rates as more buyers enter the market
This is when real estate activities increase and people generally enjoy prosperity with employment on the rise. With economy in full swing, the scarcity of skilled labor will be exacerbated and labor or material shortages may occur. There will be limited to no available buildings and landowners raise rents. At this stage, prices continue to rise and we will experience an inflationary effect with the cost of borrowing getting higher.
PHASE III: DECLINE/ HYPER SUPPLY
Characterised by: Rising vacancy/ significant new construction leading to oversupply/ new demand exhausted/ declining rent growth
Phase III is when speculative developers enter the market, while demand declines. With higher property prices, banks will begin to restrict loans. In doing so, there will be limited supply for fundings and the cost of borrowing will be expensive. The further tightening in credit supply will lead to an increased investment cost, hence resulting in a decline in economic activities and demand for property.
PHASE IV: RECESSION
Characterised by: Rising vacancy/ more completions/ possibly negative rent growth
Excess supply occurs here, resulting in a high level of vacancy. With reduced demand, prices drop – which in turn give rise to lower confidence. Businesses and consumers will be reluctant to commit to new developments; economy and the level of employment will also decrease. During Phase IV, it will be difficult for property owners to service loans and this may lead to a high incidence of mortgagee sales. This problem is exacerbated when home loan rates in Singapore (affected by macroeconomic factors) go up beyond manageable levels.
WHERE ARE WE IN THE CYCLE RIGHT NOW?
Prior to Q3 2017, we were seeing a consistent decline in home prices due to the government’s efforts to cool a red-hot property market through the implementation of cooling measures, such as in the form of Additional Buyer’s Stamp Duty (ABSD). In addition to being the longest slide since transaction data was first made available in 1975, the property values have also fallen by 12% after their peak in 2013.
However, recently the nation’s biggest developer, CapitaLand, detected signs that Singapore residential property market is “bottoming out” – reaching a bottom and will rebound. According to the Urban Redevelopment Authority (URA), 6,567 units were sold by developers and this has increased the property sales by 72% during the first half from a year earlier.
Besides investors’ perception that Singapore may be relatively more attractive as compared to cities such as Hong Kong, London or Australia, CapitaLand CEO and president Lim Ming Yan said that the extra liquidity was a factor in higher transaction volumes and slower price declines in recent months.
Based on transaction prices provided in contracts submitted for stamp duty payment and units sold by developers up till mid-September, the prices of private condominiums and apartments rose by 0.2% in Core Central Region (CCR), compared to the 0.5% fall in the previous quarter. After an increase of 0.6% in the previous quarter, prices in the Rest of Central Region (RCR) however, remained constant. In Outside Central Region (OCR), prices increased by 0.7% as opposed to a 0.3% decline in the previous quarter.
Additionally, the Housing and Development Board’s data shows that the resale volume increased by 32.5% to 6,001 transactions from 4,530 over the same period. Since Q3 2012 when there were 6,560 transactions, this is also the first time that transactions in the resale market has hit the 6,000 mark. While both the new launches and resale properties have recorded higher levels of sale volume, the secondary market saw more buzz on the whole.
Generally, there are four main property types or submarkets: industrial, residential, commercial and retail. One thing to note is that despite them being correlated, each of the submarkets may move in a separate cycle. In other words, the residential market can be at a peak while the commercial market is entering a recovery phase.
Want to find the best mortgage rate in town? Check out our free comparison service to learn more!
Read more of our posts below!


